Global Dynamic Allocation
Investor Profile
This systematic investment strategy has been designed for investors seeking a long-only, highly liquid, globally diversified exposure to equities, fixed income and currencies.
Strategy Fundamentals
Leveraging our proprietary macroeconomic models, Neural-Q quantitatively identifies the most attractive investment opportunities within the defined investment universe, aligning with the Global macroeconomic landscape.
Base Currency
The base currency of this startegy is the EURO (EUR).
Benchmark
Benchmarked against the fund: BGF Global Allocation A2

Investment Universe
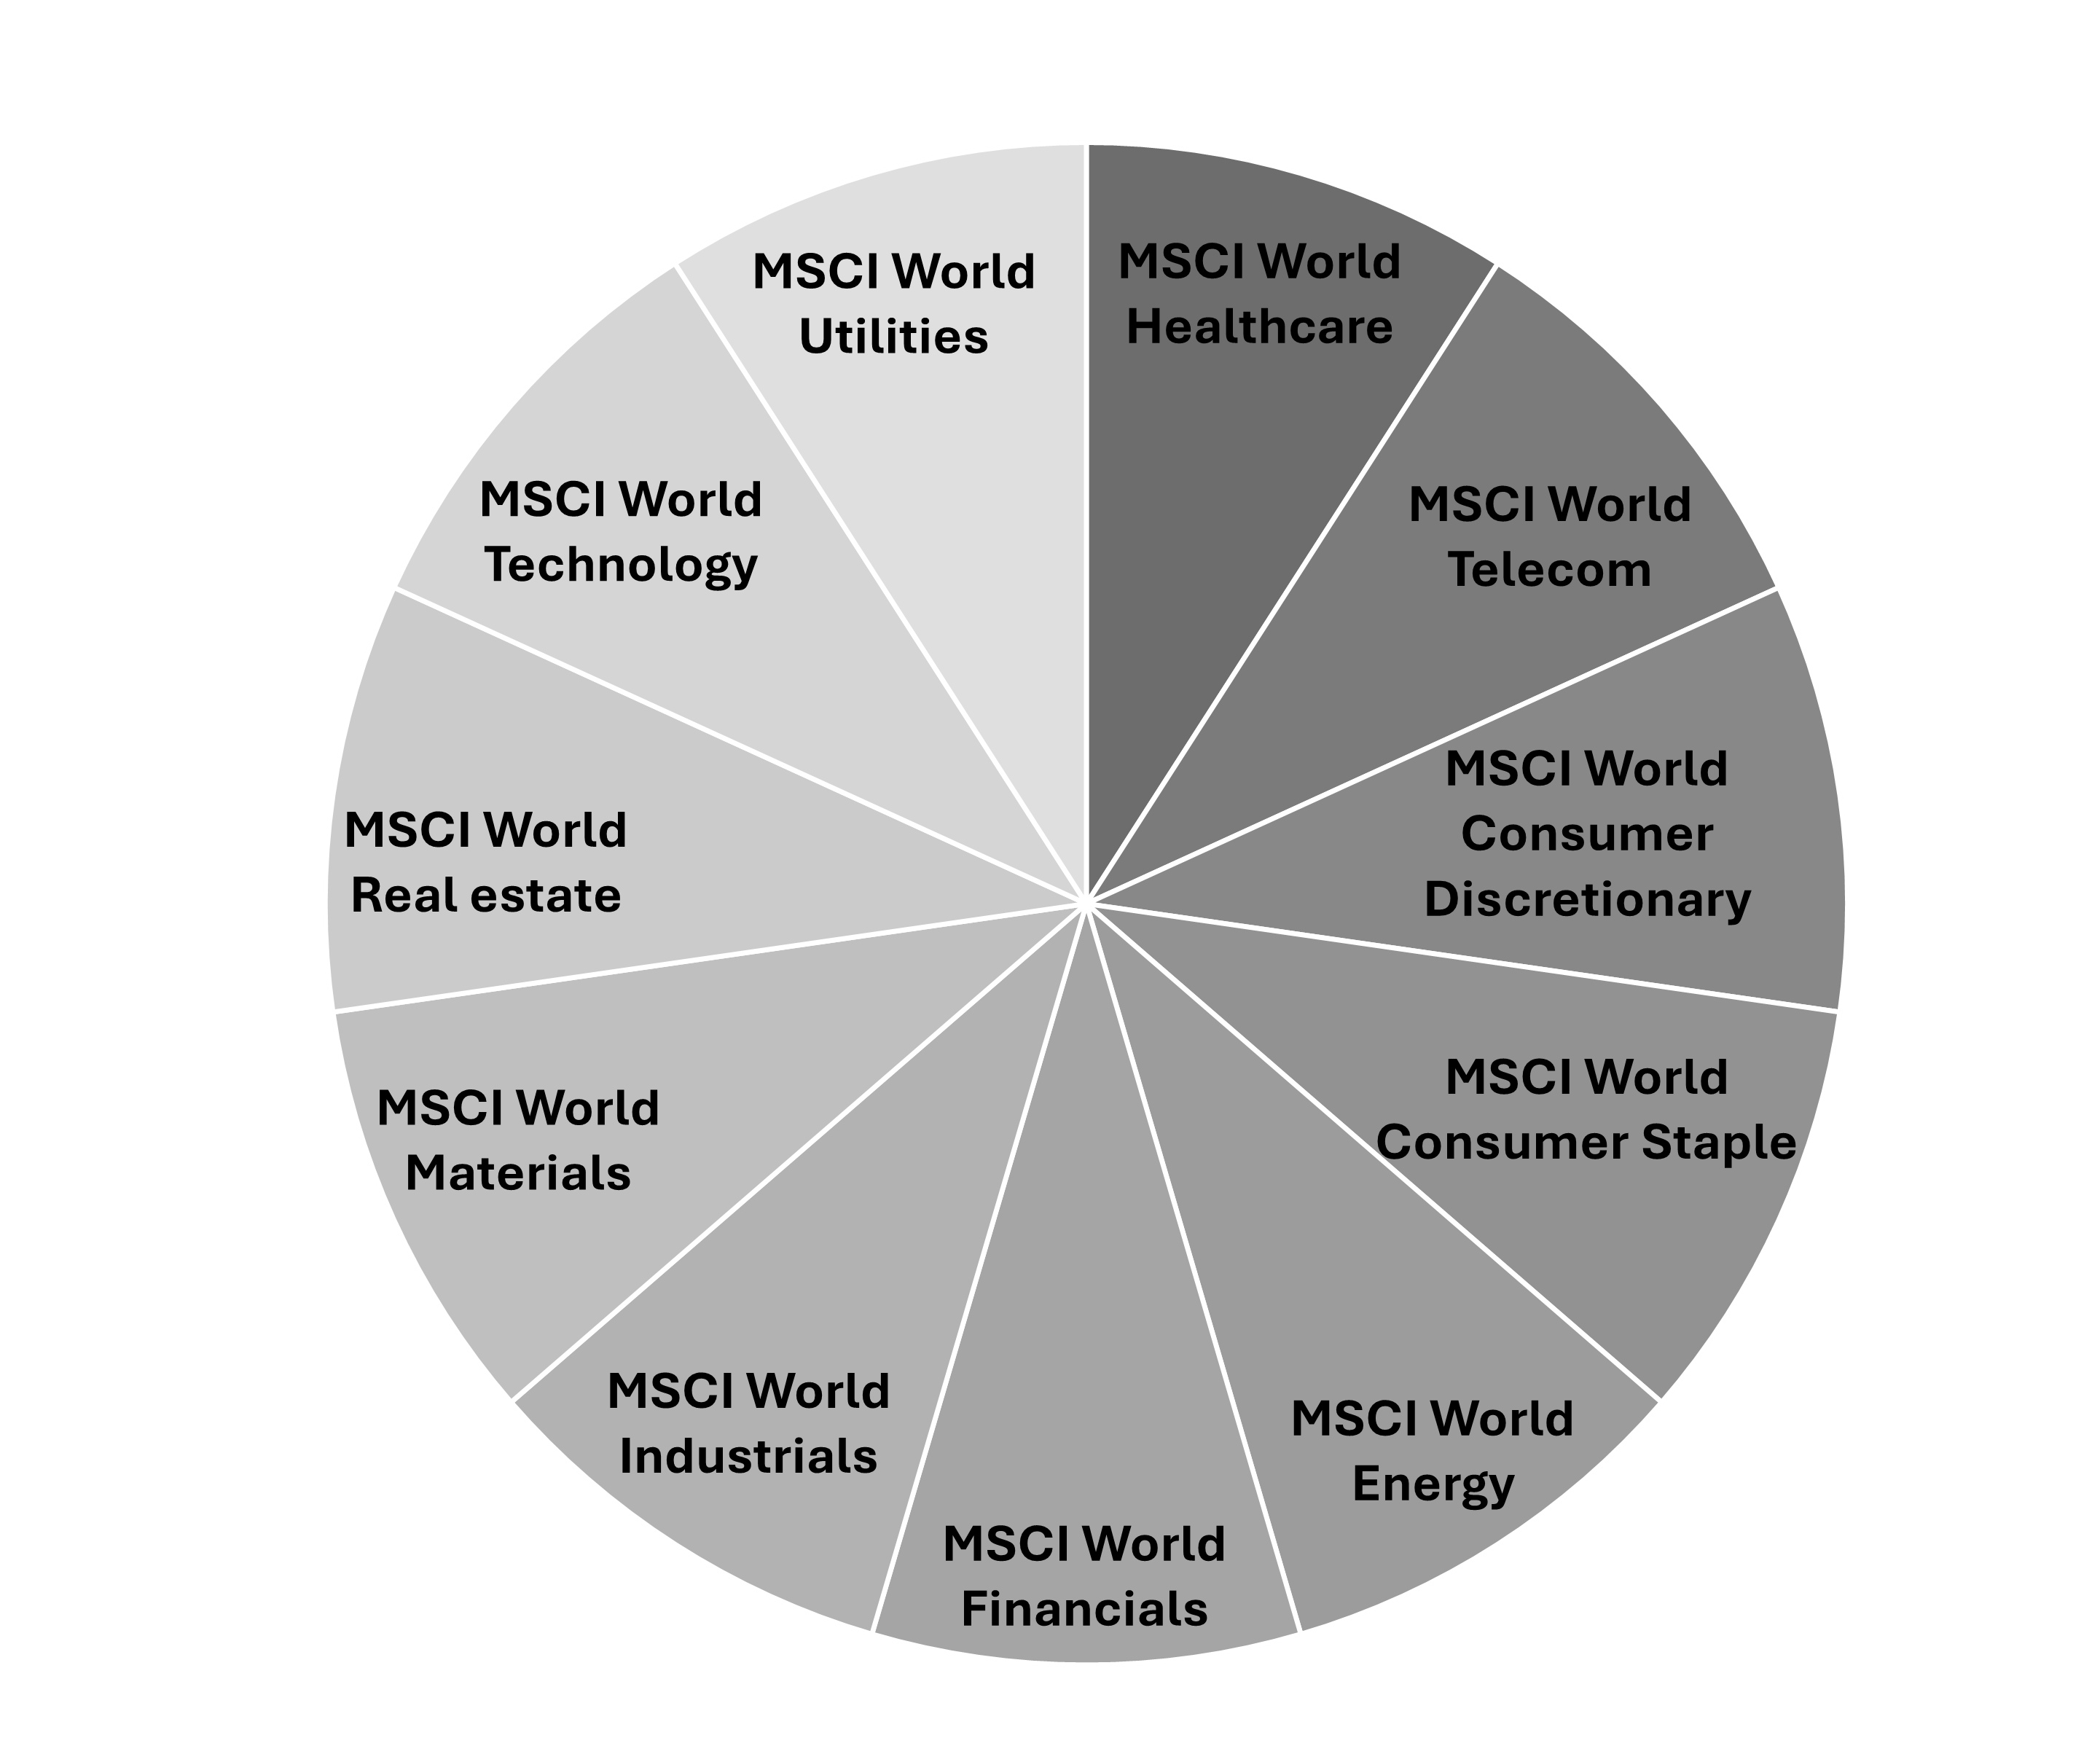
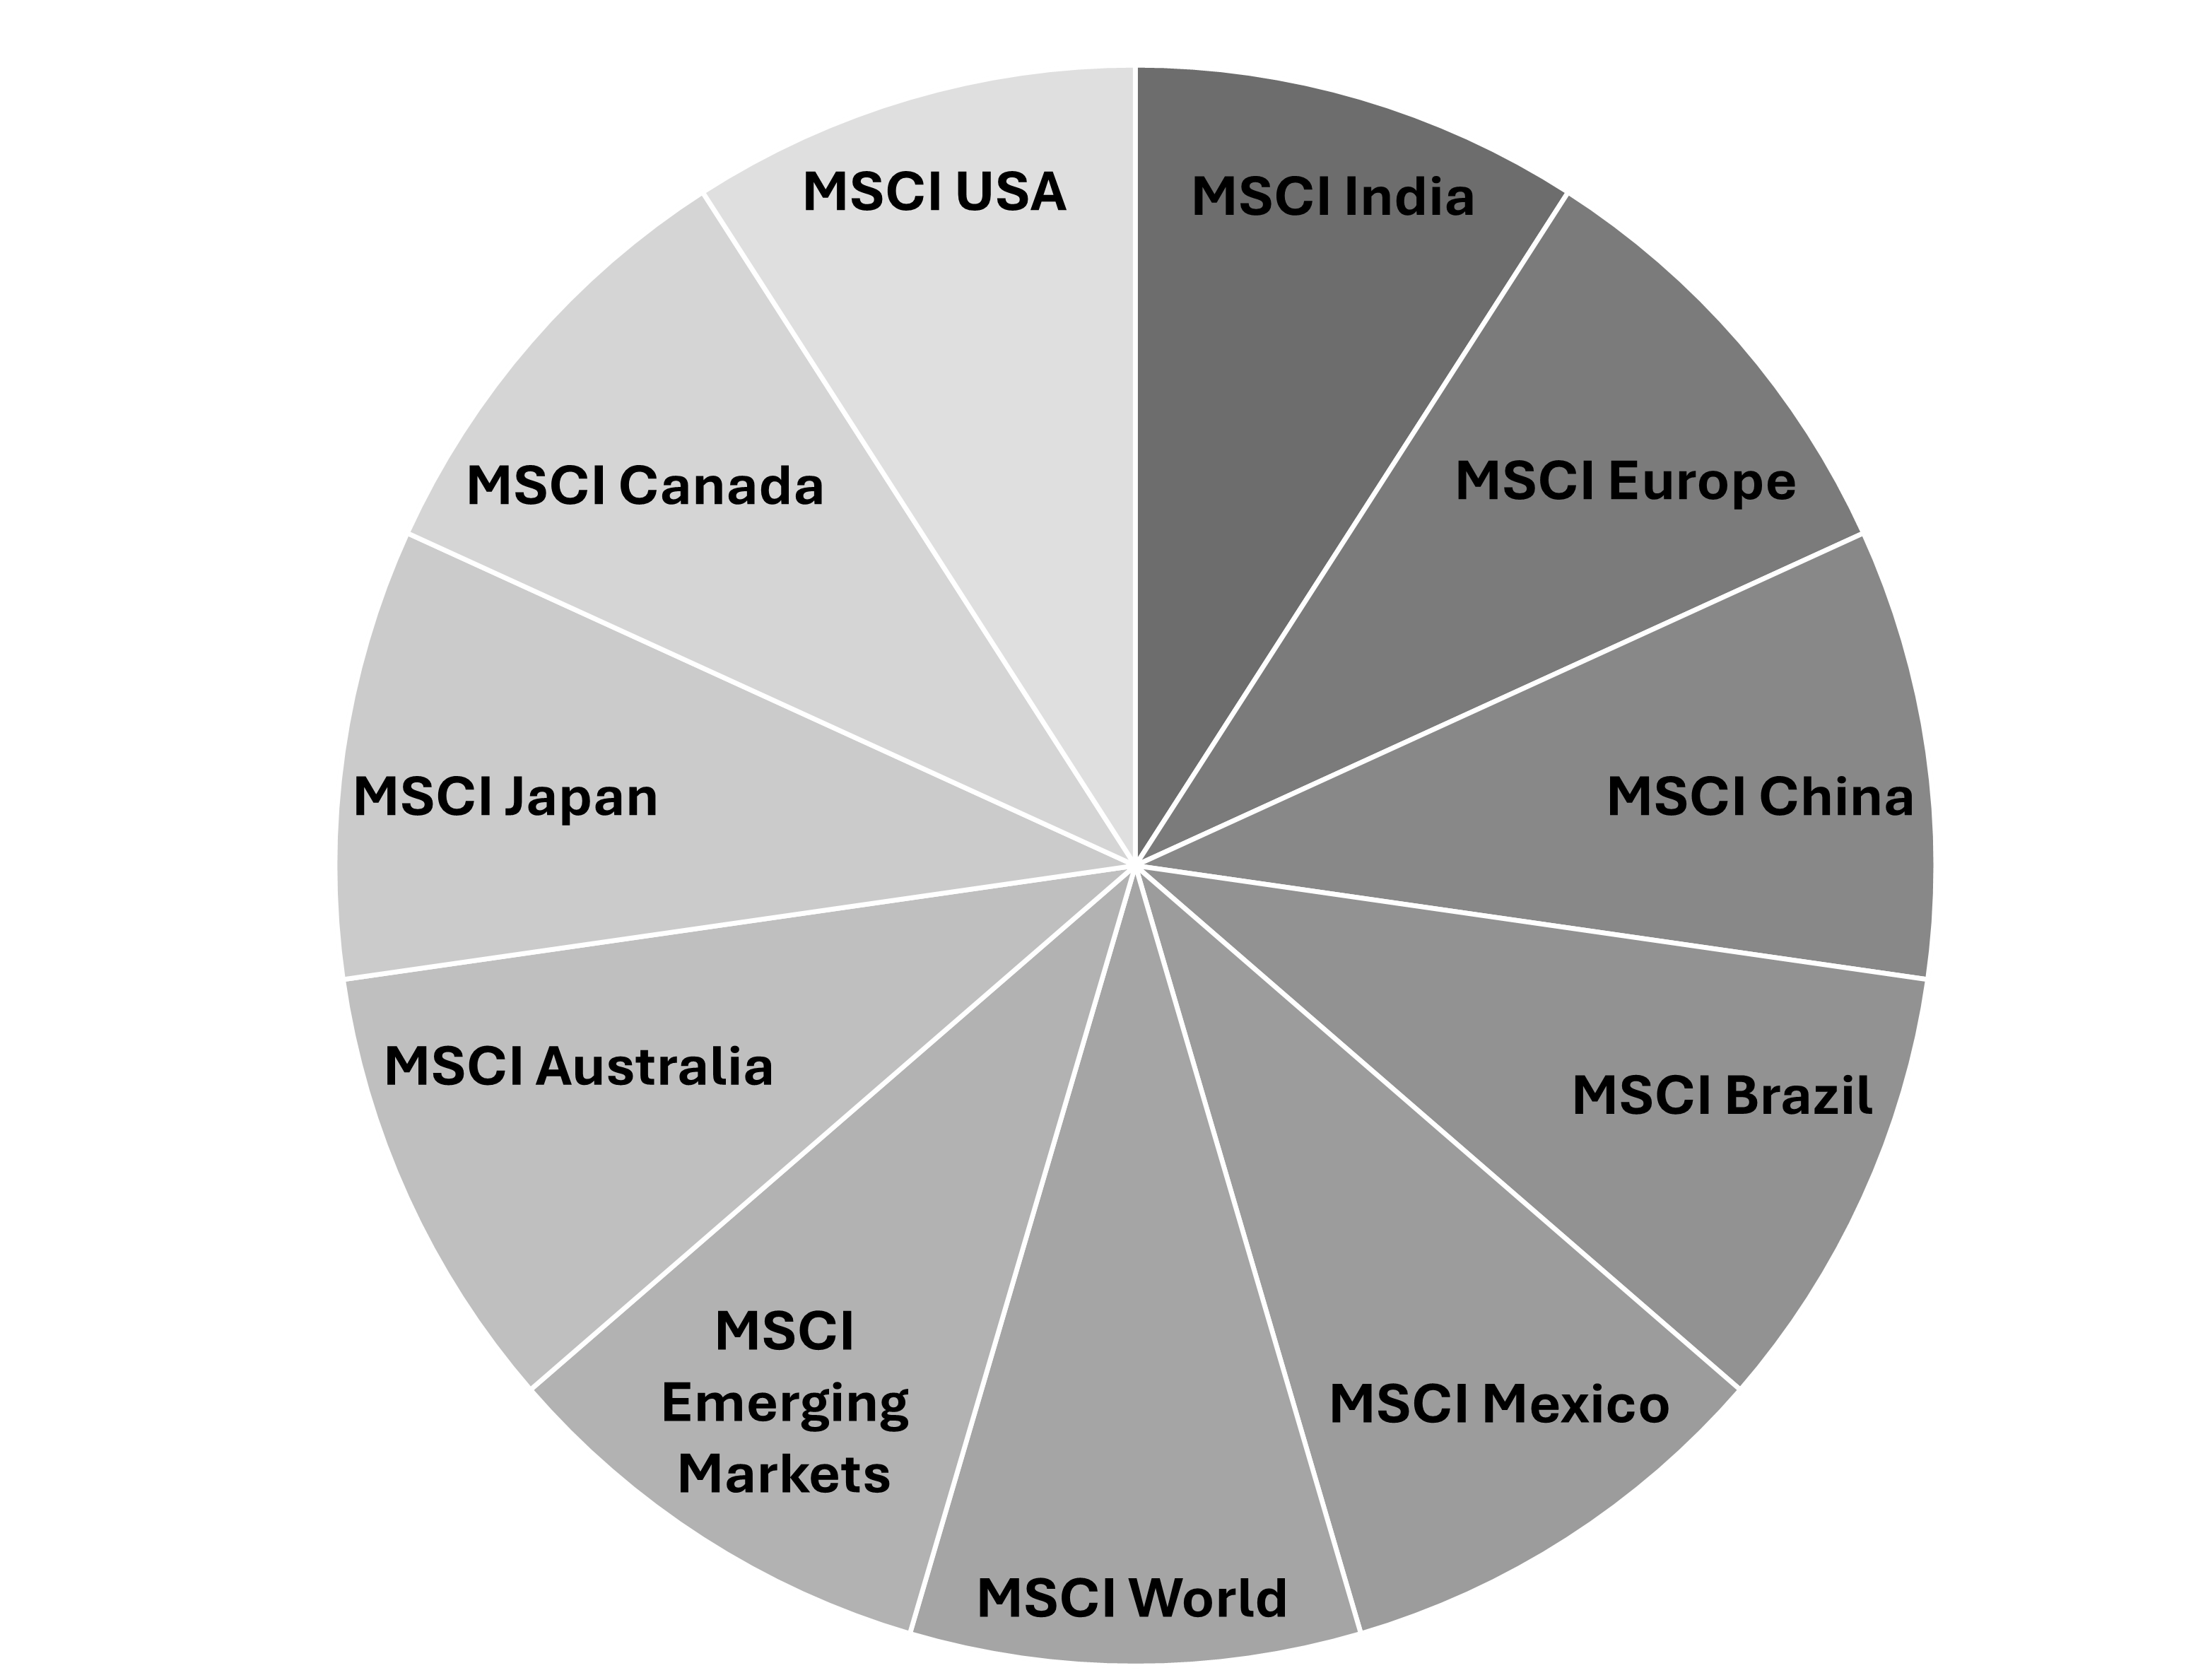
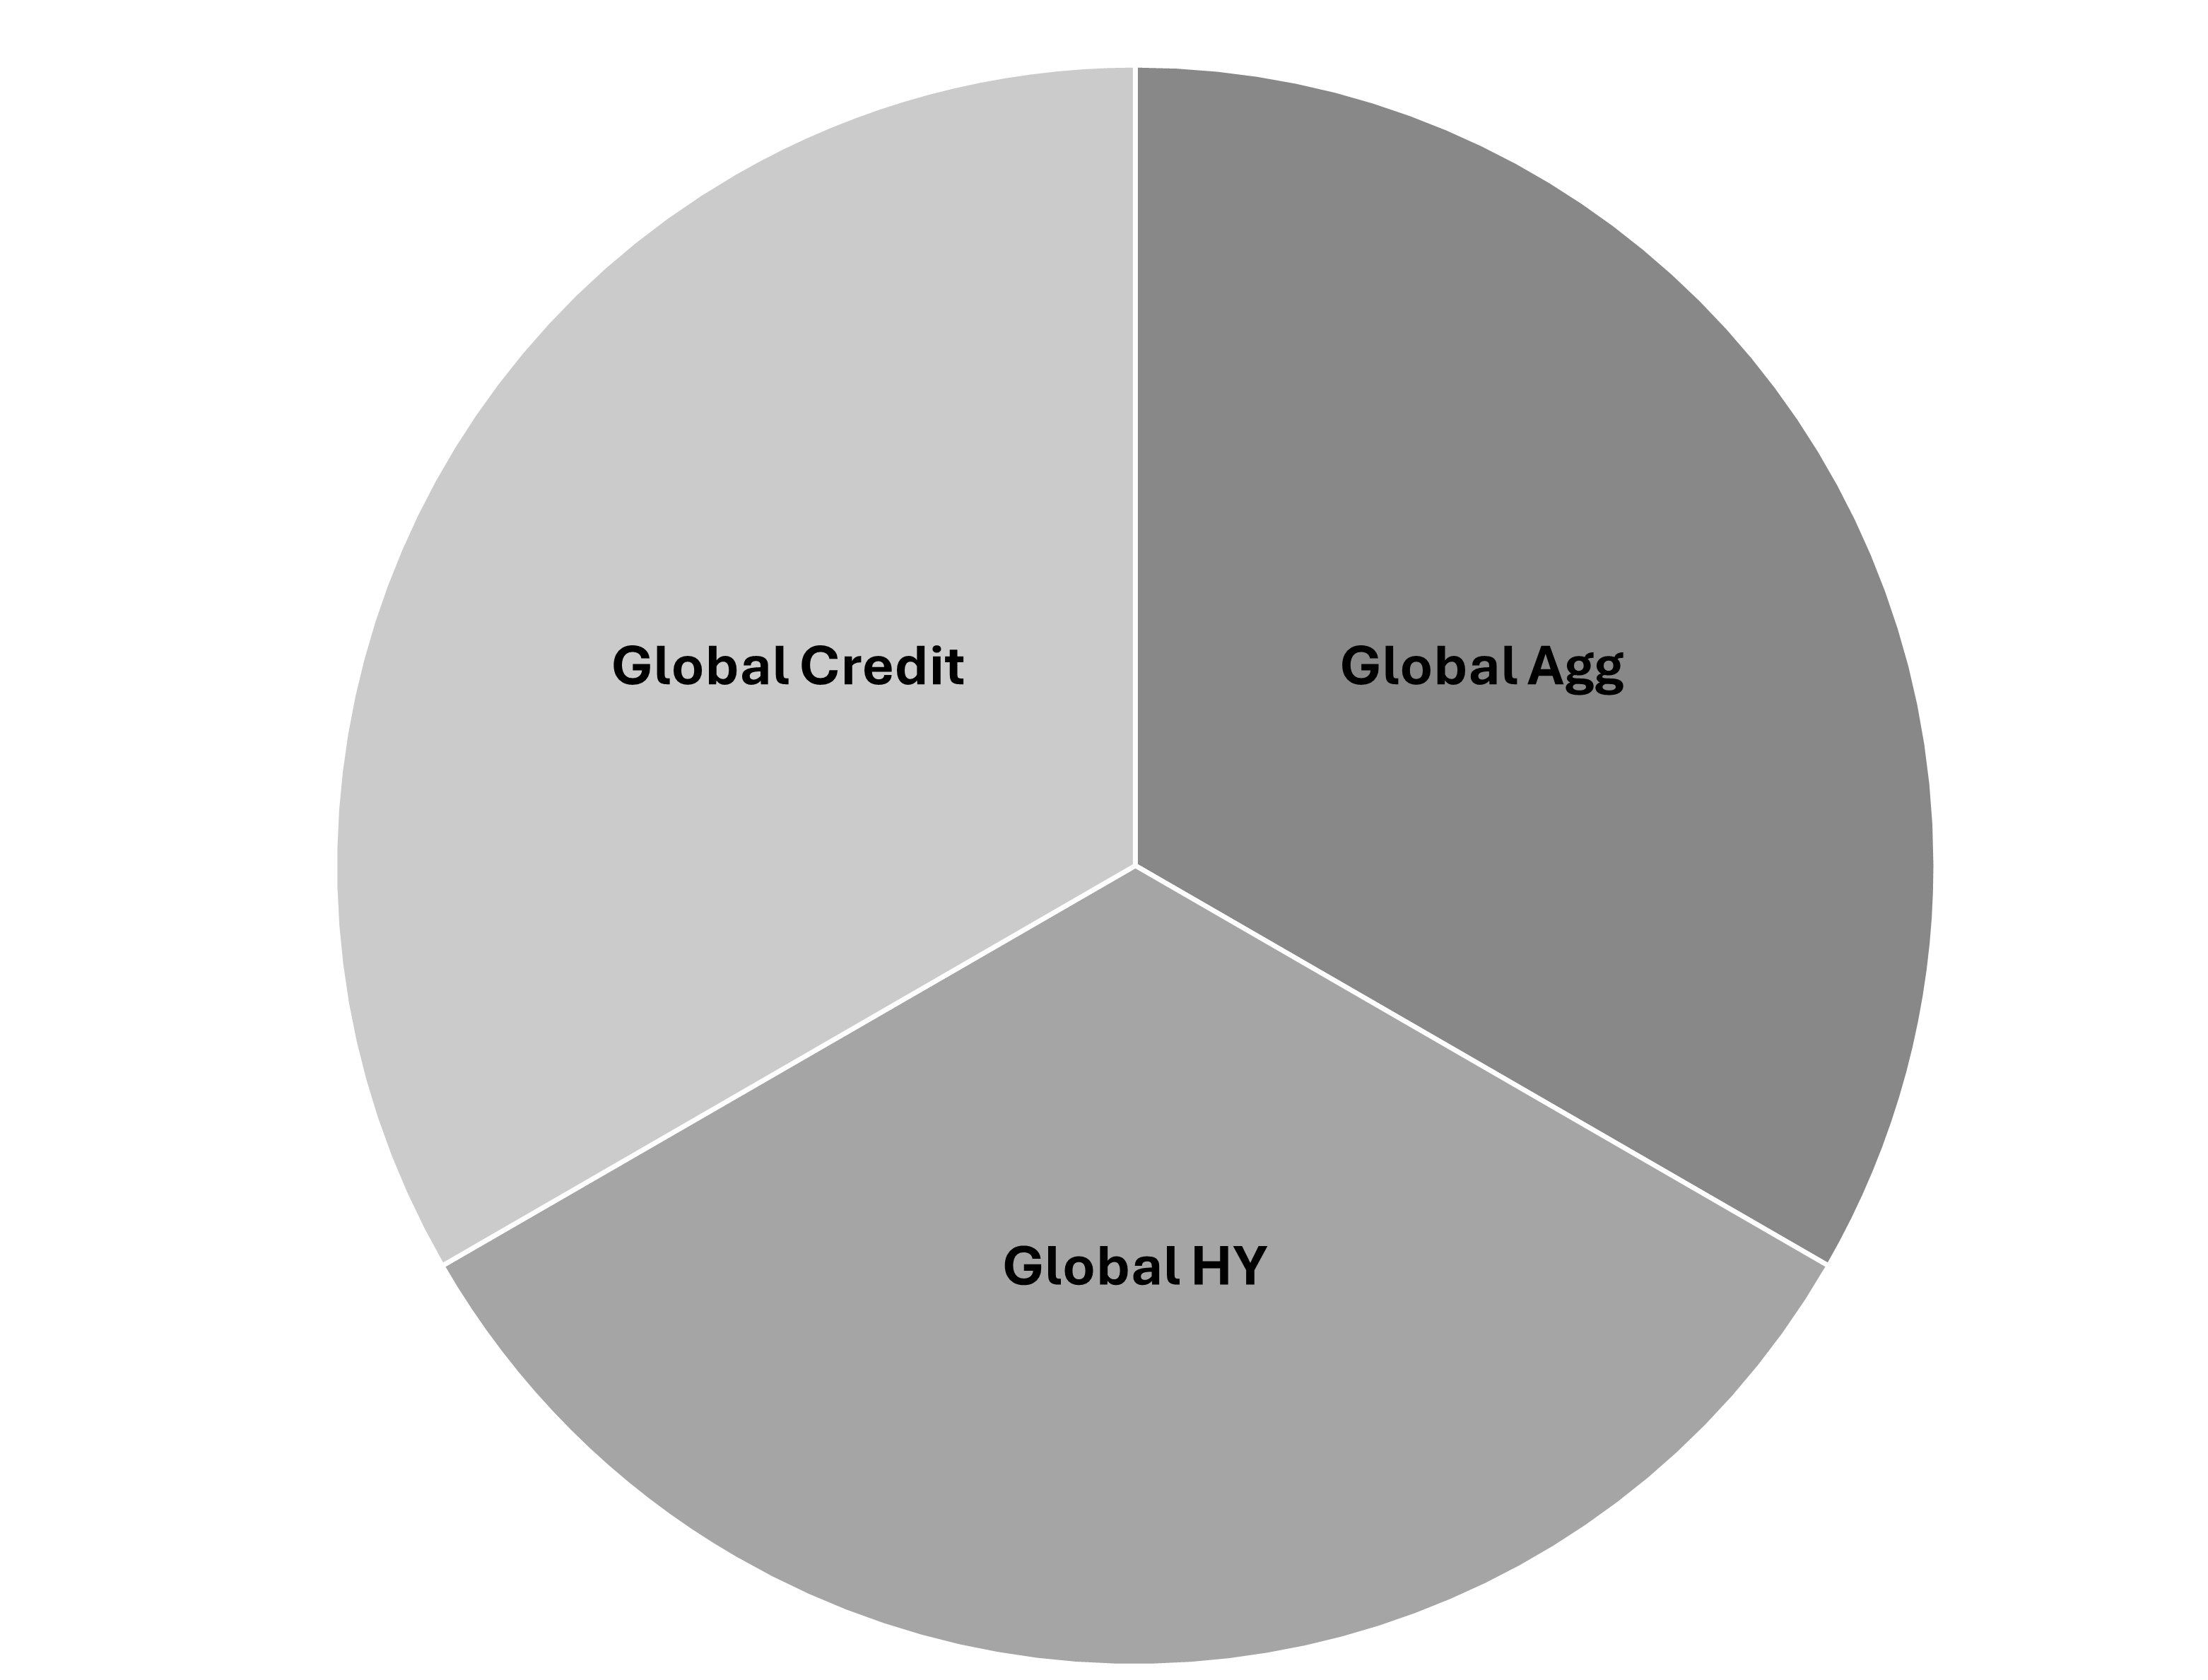
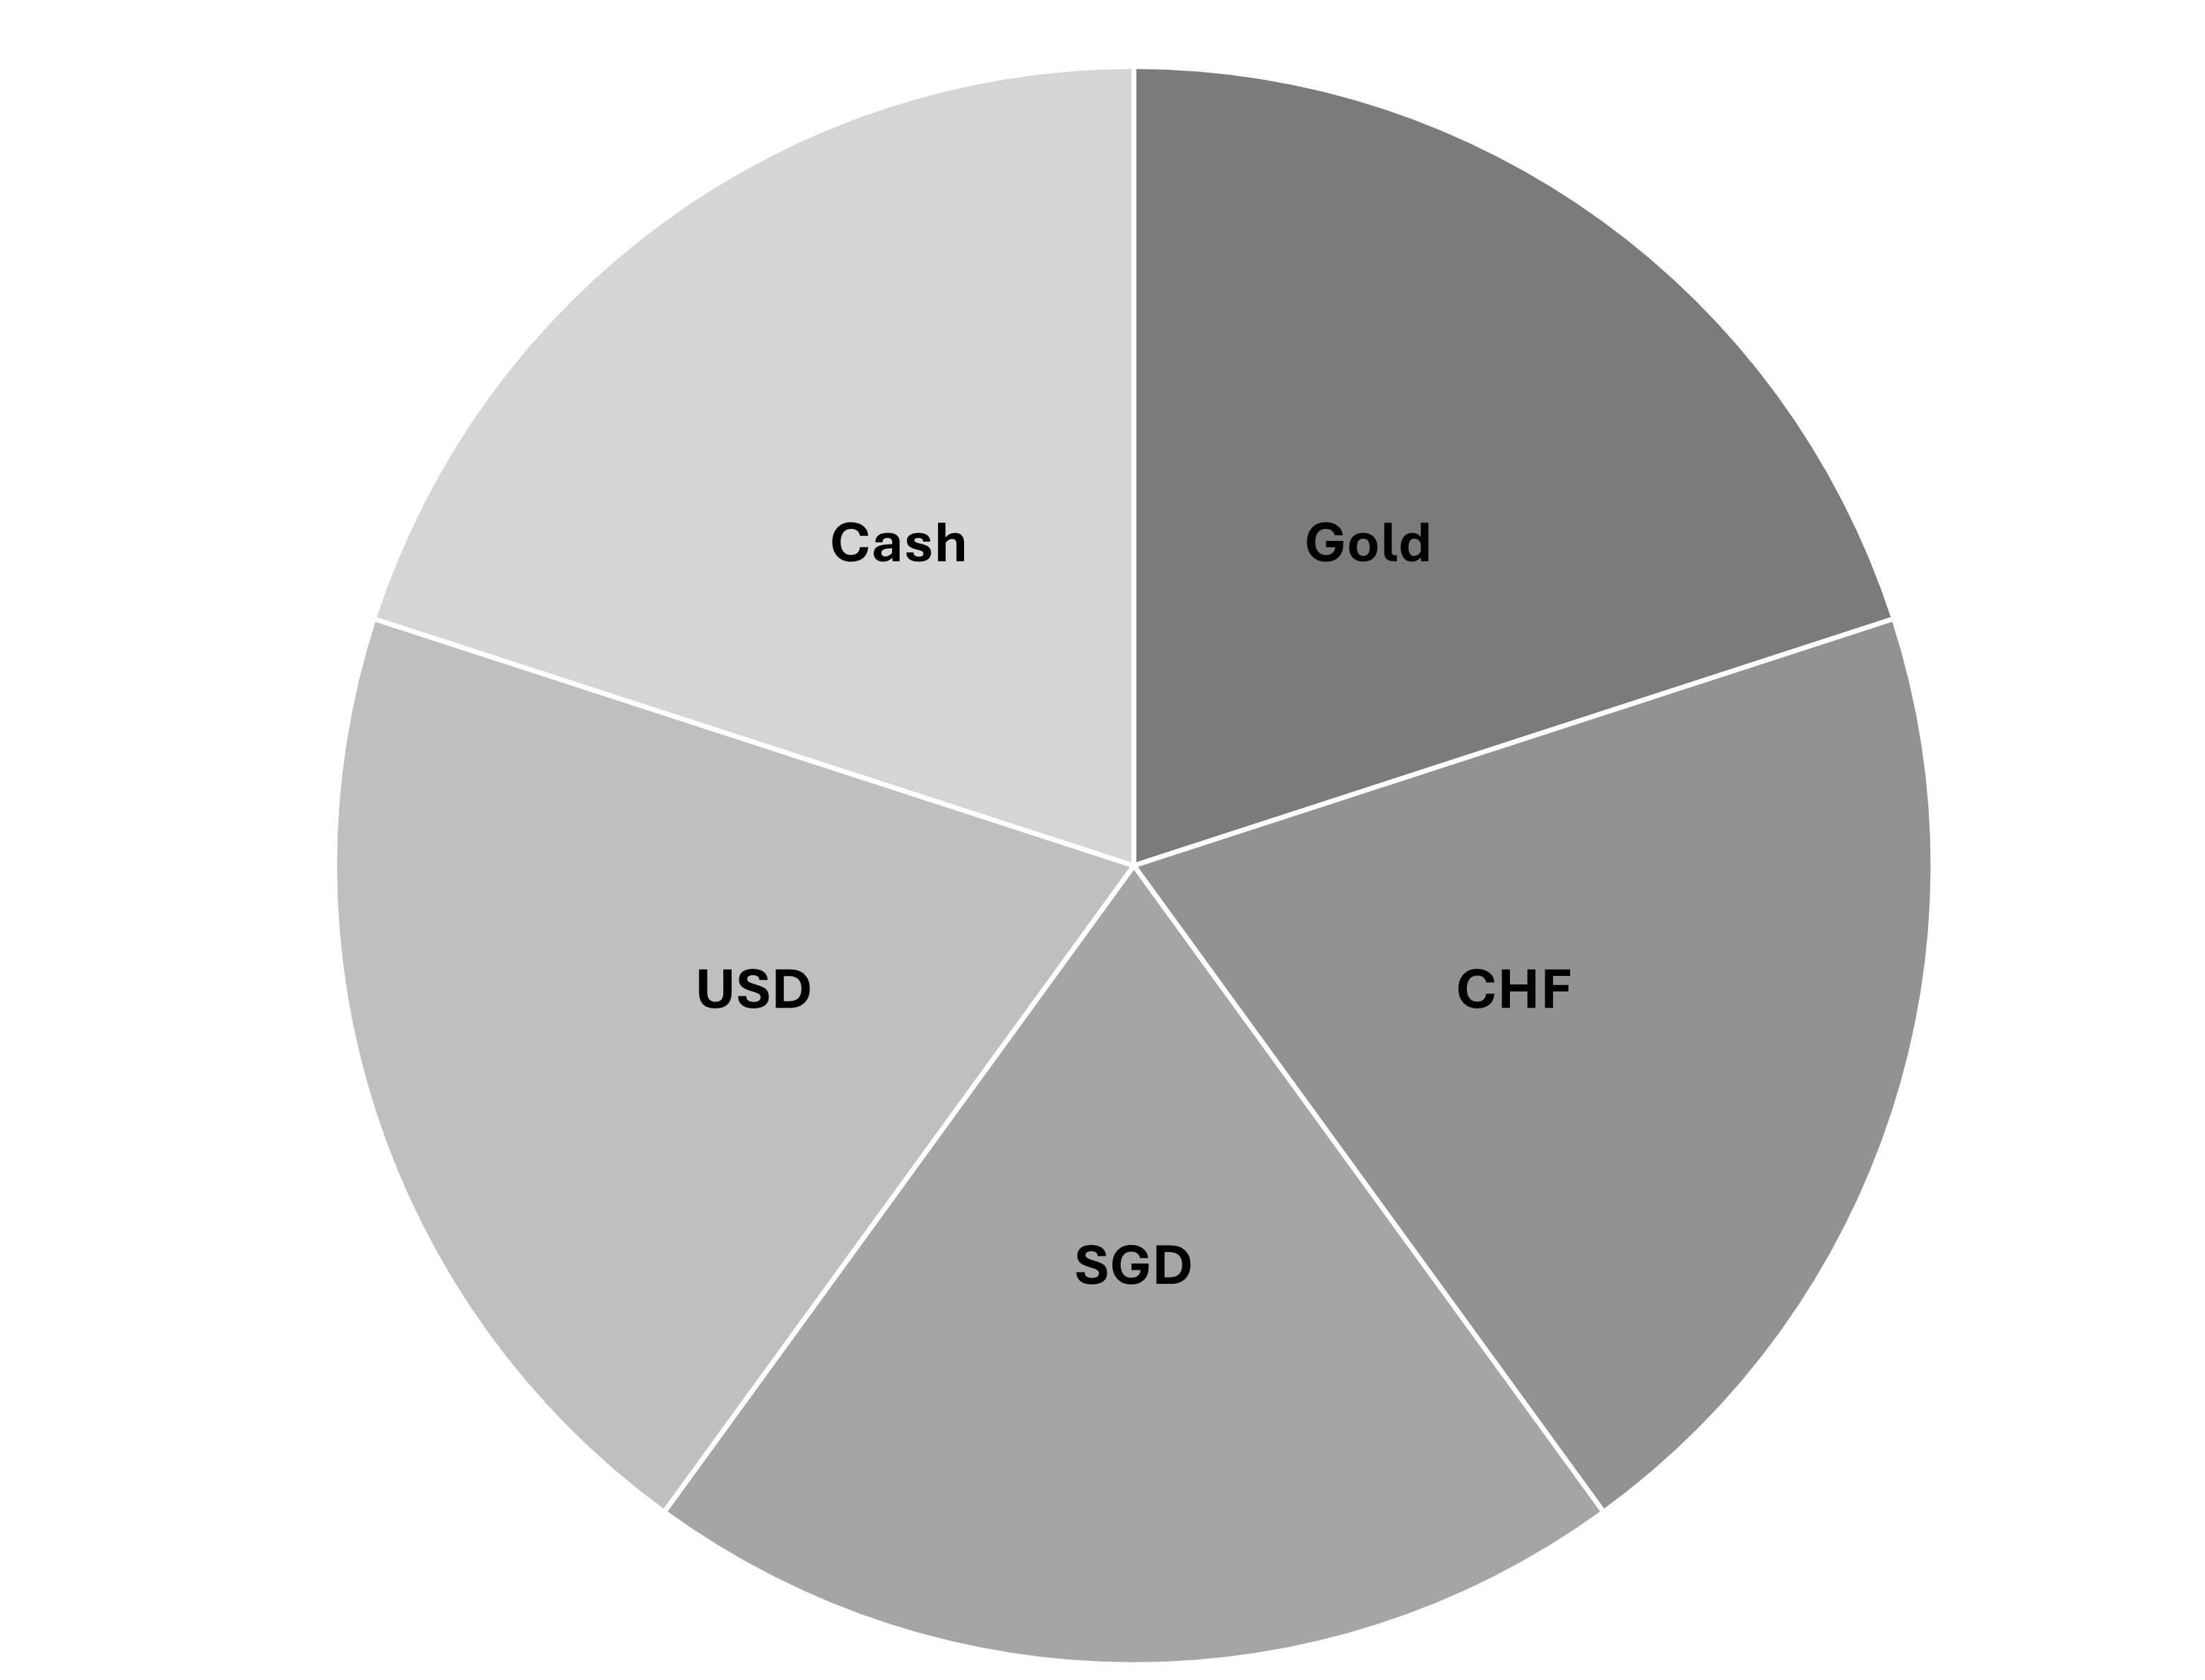
The investment universe encompasses global sector and regional Equity ETFs, Global Bond ETFs, and various currencies, including gold. This combination offers investors a globally diversified multi-asset portfolio with the downside protection of gold, CHF, and USD.
In order to achive the desired exposure, client assets are invested in simple financial products such as spot currencies & ETFs, which leverage market-cap weighted passive strategies from providers like Blackrock, State Street, and DWS.
These providers determine the allocation at the Tactical Asset Allocation (TAA) level, while Neural-Q dynamically adjusts the Strategic Asset Allocation (SAA) to remain aligned with the current global macroeconomic landscape. This approach provides investors with peace of mind, as it eliminates the need to time market entries and exits, resulting in enhanced returns and reduced drawdowns compared to conventional passive strategies.
Investment Universe in Detail
Global Sectorial Equities
Global Regional Equities
Global Fixed Income
Currencies
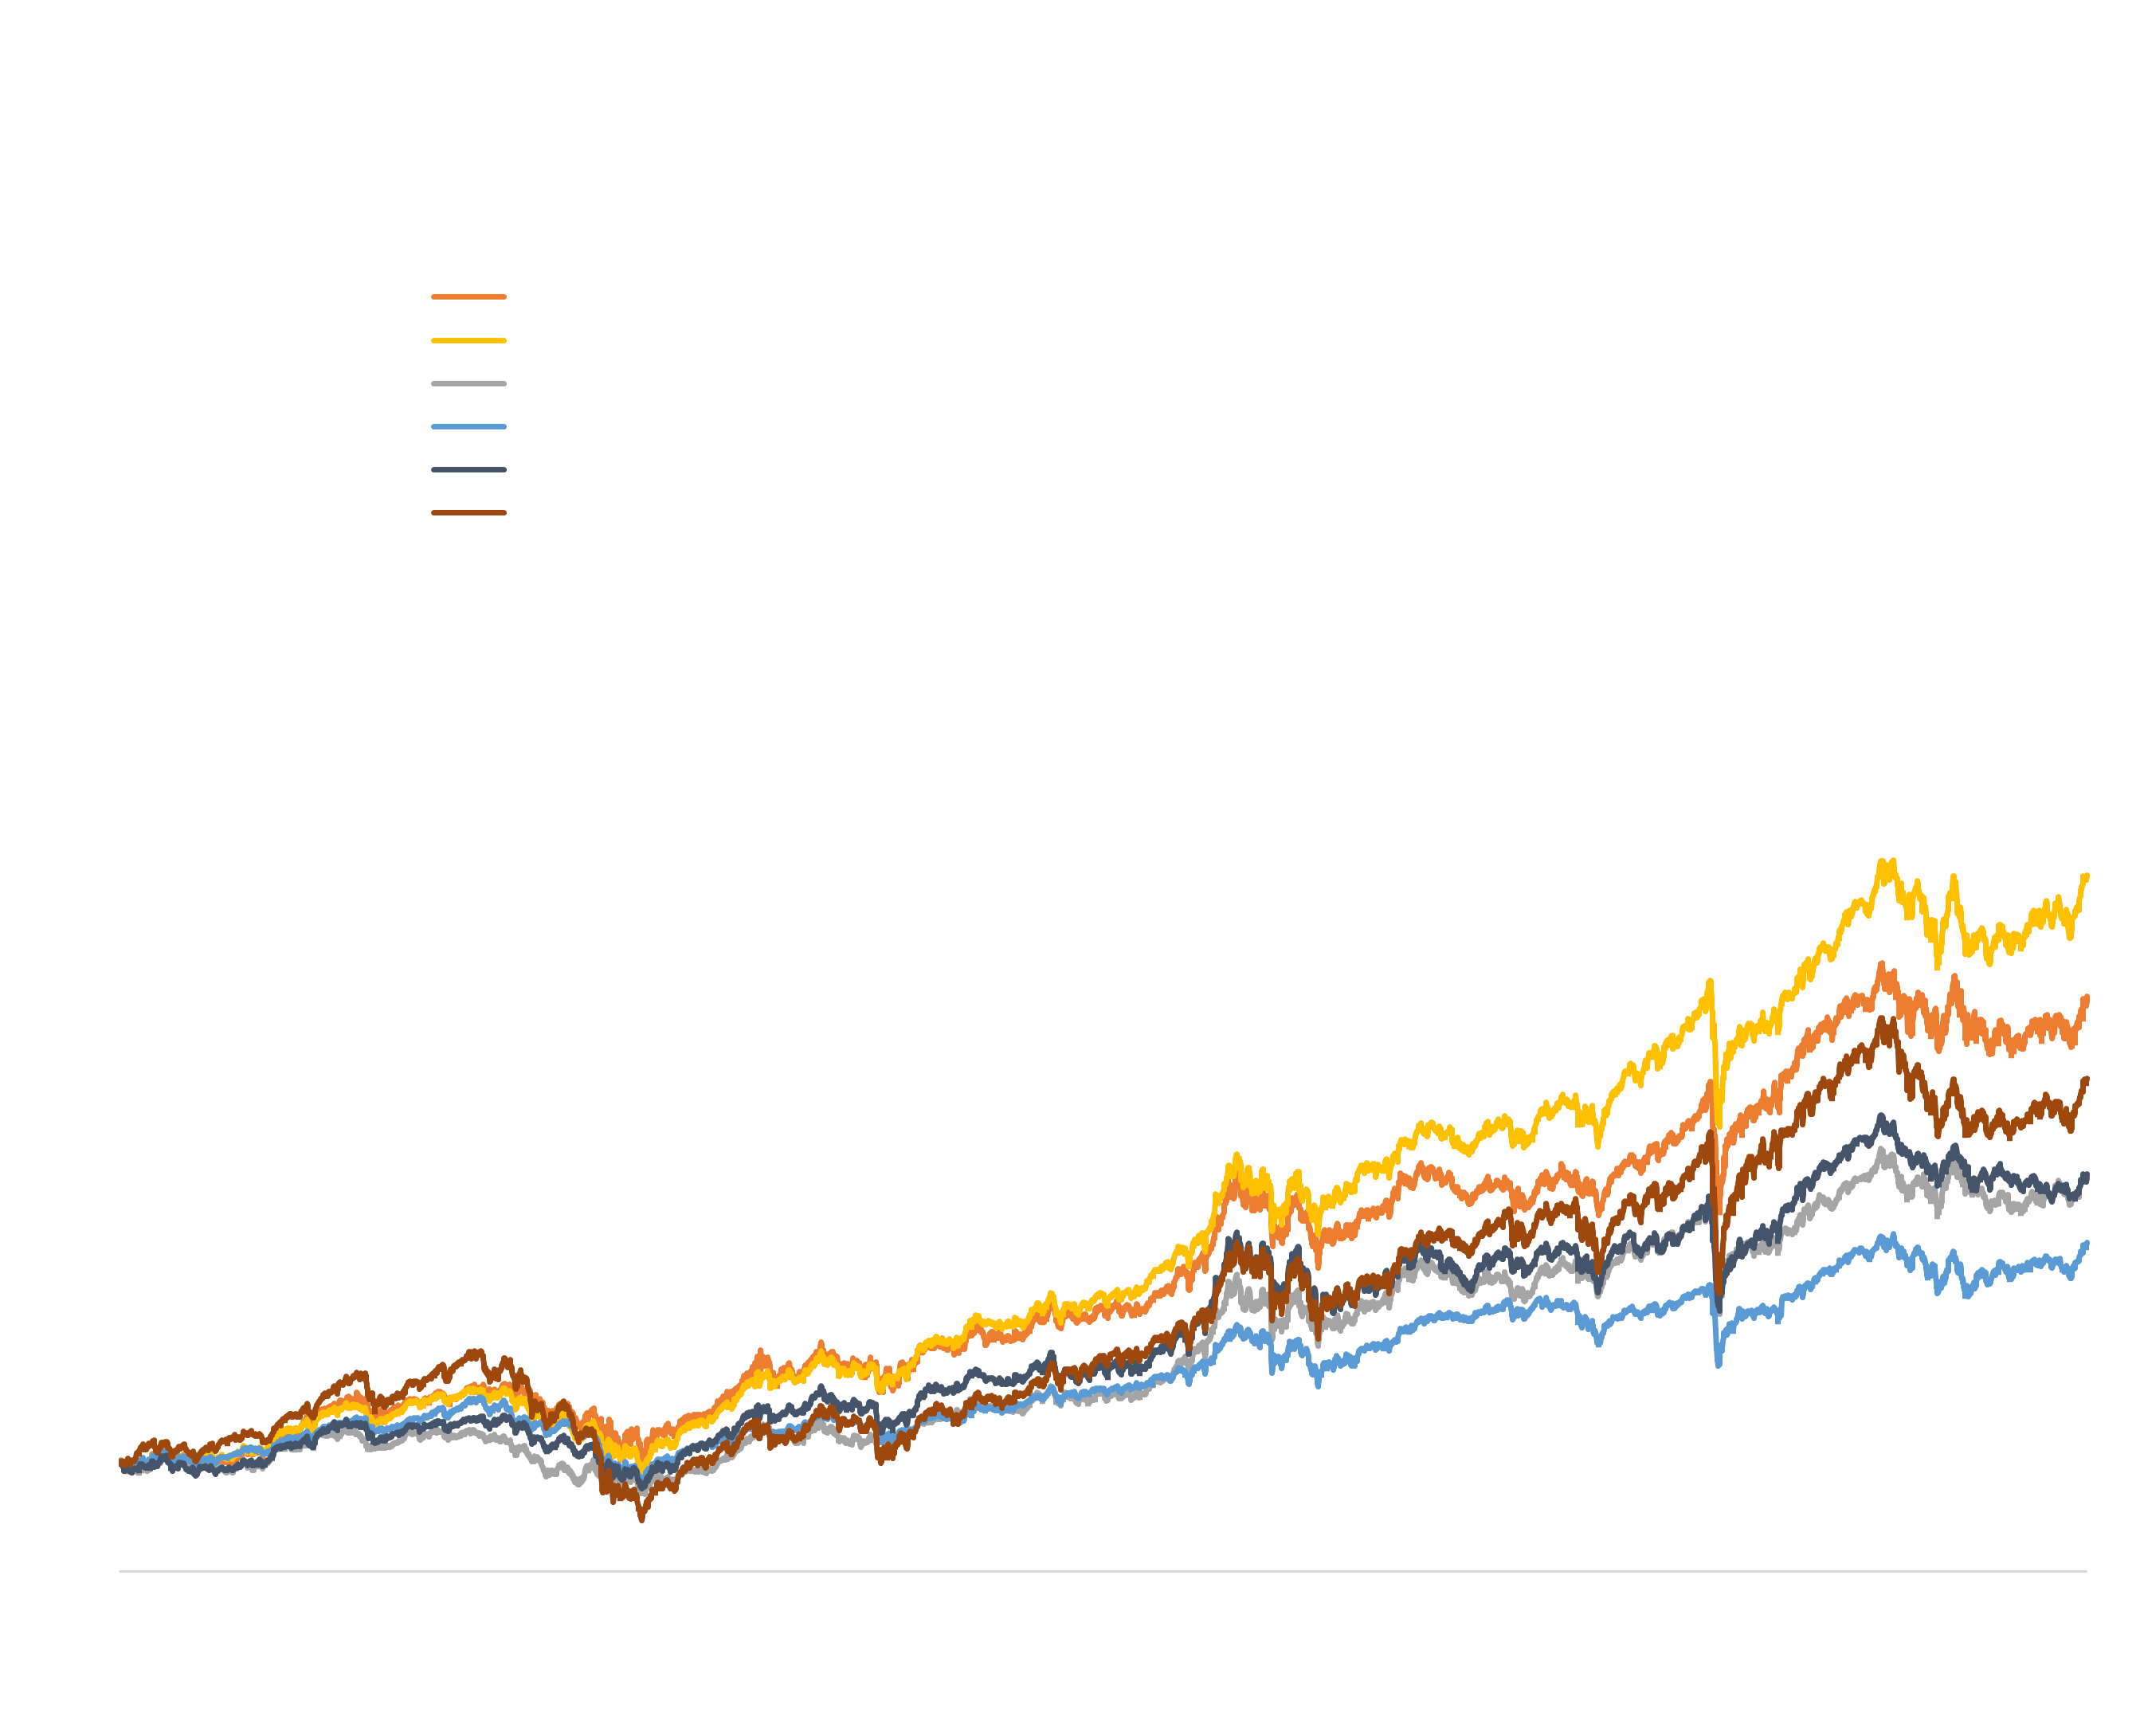
Key Statistics
Annualized Return
Profitable Years
Months of historical data
Annualized Alpha
Test Our Strategy
Compare our investment strategy with others in the market while visualizing your investment's potential growth over time using a Dollar-Cost Averaging (DCA) investment plan. To calculate the most effective reinvestment frequency for this strategy, click here.
Invest in our startegy
We lease our investment strategies to qualifying investment management institutions interested in executing and commercializing our strategies. We already have a partner set to commercialize and execute this strategy and it will soon be available for investment. Contact us for more information.
Contact UsFrequently Asked Questions
What is a systematic investment strategy?
-
Rule-Based:
The strategy follows a specific set of rules or criteria, ensuring decisions are consistent and not influenced by human emotions like fear or greed.
-
Data-Driven:
Systematic strategies often rely on quantitative data, in this case, transforming macroeconomic fundamentals into numerical values.
-
Reproducible:
Since decisions are based on predefined rules, the strategy can be tested on historical data, known as backtesting, to evaluate its past performance. This process also helps to optimize future performance.
How does the macroeconomic cycle influence this strategy?
The macroeconomic cycle represents the fluctuations in the overall economy, encompassing phases such as growth, recession, and recovery. Each phase presents distinct opportunities. Our strategies are designed to capture these opportunities by interpreting signals from macroeconomic data, ensuring that investments are quantitatively aligned with the current economic environment.
Is the strategy's historical performance data reliable?
Backtesting involves using historical data to test how a strategy would have performed.
To ensure its accuracy, we:
- Employ high-quality, unbiased, point in time data.
- Account for all transaction costs and slippages.
- Regularly update and cross-verify our data sources.
- Conduct out-of-sample tests to confirm our findings.
In addition, we made our backtester open-source, so our calculations can be checked. Github Link
Will the strategy perform in future market conditions?
While our strategies are founded on robust fundamental research and thorough testing, it's crucial to recognize that markets aren't always rational. Nevertheless, we believe that, over the long term, fundamentals prevail. Thus, this strategy is well-positioned to continue outperforming.
In addition, as time progresses, more data is generated, which can improve the precision of the asset allocation. This is likely to result in enhanced performance.
How do you account for model overfitting?
Overfitting occurs when a model is too closely tailored to historical data and may not perform well on new data. We address this by:
- Keeping our models parsimonious, focusing on essential variables.
- Implementing regularization techniques.
- Employing out-of-sample validation.
- Apply cross-validation methods to assess the model's performance on different subsets of data.
Why does this strategy show a significantly lower drawdown than its benchmark?
Our strategy's investment universe includes gold, USD, and CHF. These assets have a history of appreciating during turbulent market conditions, thereby reducing drawdowns. Additionally, Neural-Qs are designed to anticipate the likelihood of such market disruptions and adjust the portfolio accordingly to mitigate potential declines.