Will the S&P 500 Perform Next Year?
The S&P 500 has risen by more than 50% over the last two years, raising the question: will this trend persist into next year? To explore this, we will examine historical periods when the S&P 500 delivered a similar two-year performance, and see what followed in the subsequent months and years.

The line chart above shows the top 5 highest correlated historical periods to the current 2 year period. During these historical periods we saw:
- 1962-11-13 to 1964-11-13: A stable, post–WWII U.S. economy under Kennedy and then Johnson, featuring steady growth, rising consumer confidence, and the foundations of the “Great Society” programs.
- 1984-12-10 to 1986-12-09: A booming mid-Reagan-era economy with reduced inflation, deregulation, strong consumer spending, corporate mergers, and sustained equity market growth.
- 1934-09-14 to 1936-09-17: A recovery phase during the Great Depression, buoyed by New Deal policies, improving confidence, and modest market rebounds from historic lows.
- 1994-11-29 to 1996-11-25: Mid-Clinton-era expansion with low inflation, tech-driven optimism, NAFTA-induced trade growth, stable Fed policies, and balanced budget trends, boosting equity confidence.
- 2012-12-04 to 2014-12-04: Post–Global Financial Crisis healing, supported by Fed quantitative easing, improving corporate earnings, job growth, and rising investor sentiment.
- 2022-12-08 to 2024-12-10 (Current): A post–COVID-19 environment adapting to shifting monetary policies, inflationary pressures, supply chain adjustments, geopolitical tensions, and ongoing technological change.

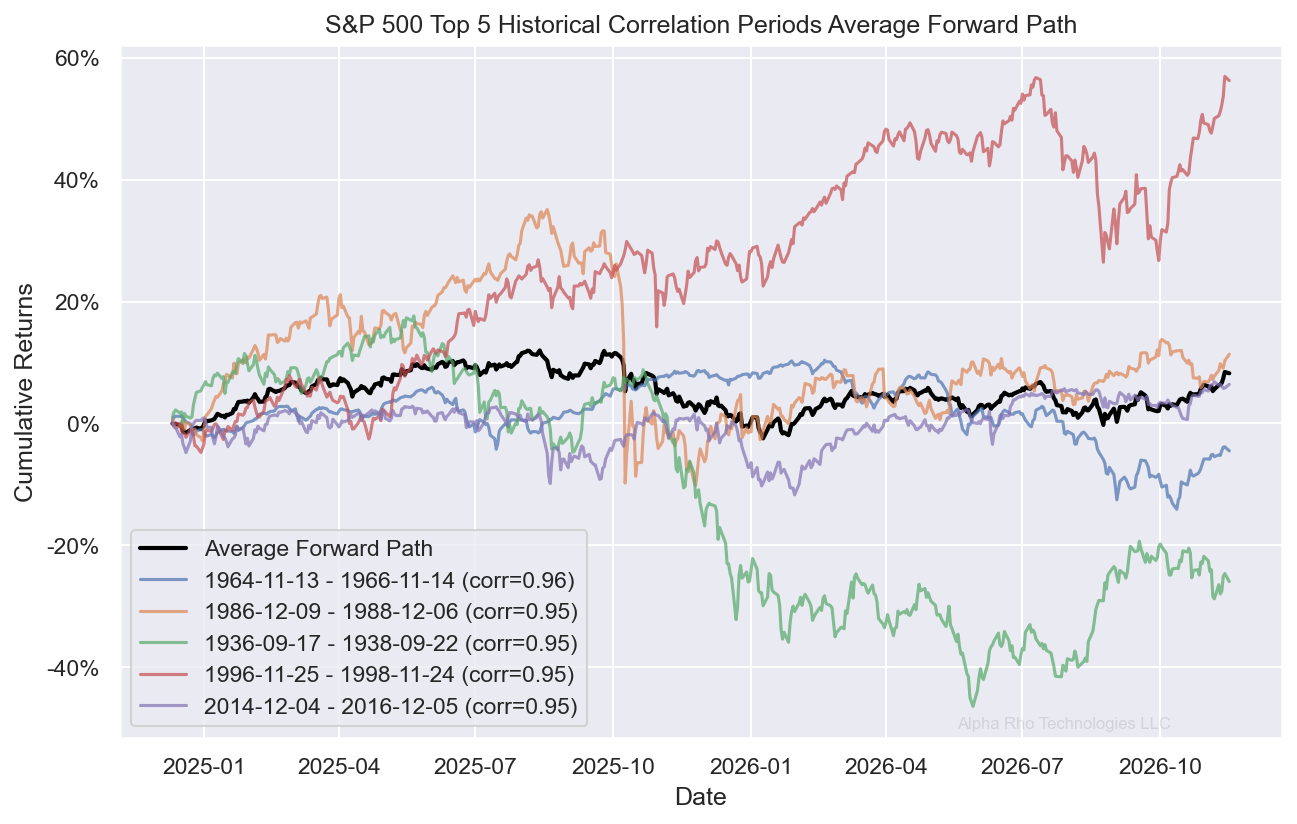
The plot above illustrates the subsequent 2-year performance paths for the previously analysed periods. On average, the forward returns hover between 0% and 10%. Notably, the largest downturn was about -40% (1936–1938), while the strongest upswing reached approximately +55% (1996–1998). Historical Context:
- 1936–1938: This window captures part of the late-Depression recovery in the U.S. Although the economy had made significant progress since the worst of the early 1930s, the late ’30s brought renewed challenges, including the “Roosevelt Recession” of 1937–1938. Tightening monetary and fiscal policies, along with lingering economic fragility, weighed on investor sentiment, leading to substantial market volatility.
- 1996–1998: The late 1990s were marked by the booming U.S. economy in the run-up to the tech bubble era. Low inflation, strong corporate earnings, increasing productivity (often credited to emerging technologies), and pro-trade policies fueled robust market returns. While there was the Asian Financial Crisis (1997) and Russian debt crisis (1998), the U.S. stock market largely absorbed these shocks, continuing an upward trajectory as the dot-com wave gathered strength.
Conclusion:

While there are many approaches to forecasting next year’s outcomes, we believe investors should emphasize historical periods most similar to today’s environment. Right now, we’re navigating a technological revolution affecting every sector of the economy. Given these conditions, we believe that the current fundamental backdrop more closely resembles the 1996–1998 period than the 1936–1938 period.