Next Year S&P 500 Performance Expectations
The S&P 500 has experienced a significant year-to-date rally of 26%, coming on the heels of a 24% increase in the previous year, which cumulatively amounts to a 56.21% rise. This rapid pace of gains raises a pertinent question about market sentiment: are we seeing an overly optimistic market?

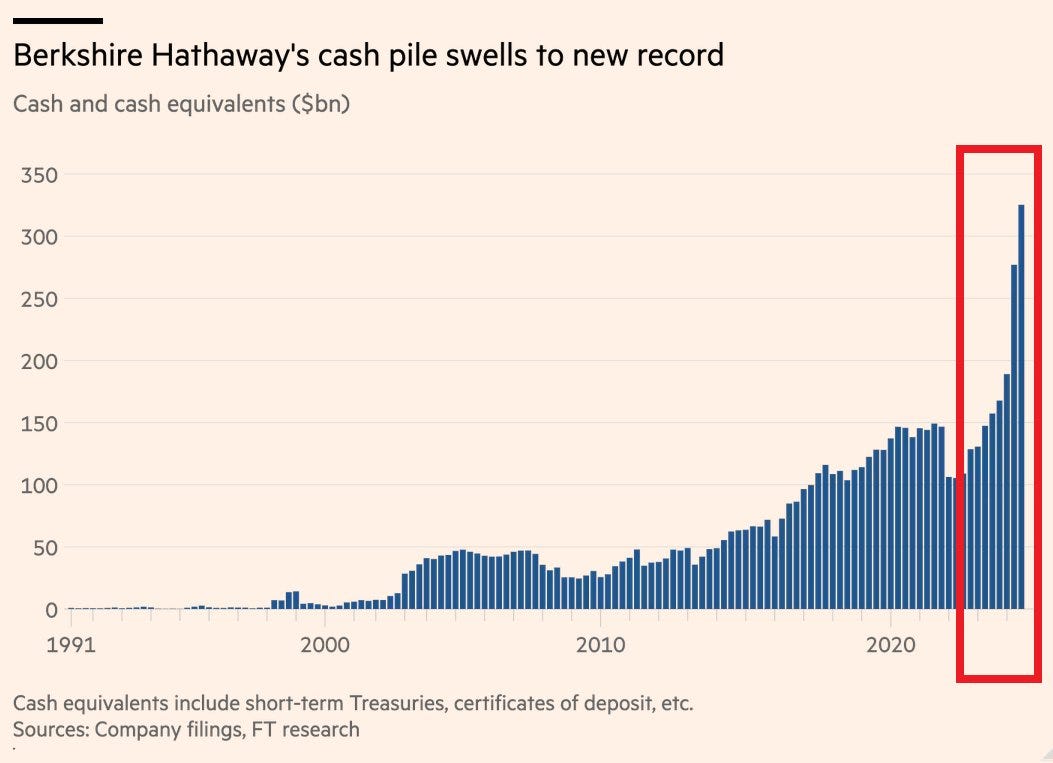
This year, Warren Buffett has been notably amassing cash at Berkshire Hathaway at a pace that has set new records, reflecting a cautious approach to the current market environment.

Looking at historical trends, the S&P 500's performance over two-year periods often reverts to the mean after periods of extreme highs or lows. This pattern of mean reversion is clearly visible in the accompanying chart, which tracks the 2-year rolling percentage change of the index. Presently, the two-year returns for the S&P 500 are notably high, standing at 1.43 standard deviations above the historical mean. This level of deviation suggests that the current market conditions are unusually favourable and might not be sustainable in the long term, potentially leading to a moderation or correction in future returns.

The bar chart illustrates that only six times in history has the S&P 500 seen such high two-year performance. In those instances, the index averaged a 4.95% return in the following year, with a wide variability (standard deviation of 26.6%) and a median return of 11.07%. The most severe drop was in 1937, following an 80.84% rally from 1934 to 1936, where the index plummeted by 38%.
The 80.84% rally from 1934 to 1936 was driven by recovery efforts following the Great Depression, bolstered by New Deal policies that reinvigorated consumer confidence and stabilized the economy. However, the sharp 1937 downturn stemmed from a combination of over-optimism, speculative excess, and policy missteps. These included the Federal Reserve tightening monetary policy to curb perceived inflation and government spending cuts aimed at balancing the budget, which collectively triggered the Recession of 1937–1938.
Conclusion:
Analyzing historical trends is crucial, but understanding the current economic context is equally important.

As shown in the chart above, investor positioning in the S&P 500 is highly optimistic in an environment marked by geopolitical tensions, inflation uncertainties, and high levels of government debt.

Drawing parallels to the 1937 downturn, there is a risk that fiscal deficits may shrink as investors grow increasingly concerned about the sustainability of government finances. A loss of confidence in fiscal policy could lead to contractionary measures, which historically result in lower GDP growth and declining income levels, thereby exerting downward pressure on the stock market.
However, this risk could be mitigated by accommodative monetary policies. Central banks may respond by lowering interest rates or implementing quantitative easing measures, effectively transferring leverage from the public to the private sector. Such actions can stimulate economic activity and provide support to the stock market by fostering an environment of growth.
In the short term, a market correction appears highly probable given the current euphoria, elevated valuations and economic uncertainties. Over the long term, however, the S&P 500 is well-positioned for gains, driven by advances in AI and broader technological progress. These innovations are expected to boost productivity, reduce costs, and increase supply, creating a solid foundation for sustained economic and market growth.