Goldman Sachs Bold S&P 500 Prediction Analysis
This week, David Kostin, Chief US Equity Strategist at Goldman Sachs, released a report forecasting that the S&P 500 is expected to deliver approximately 3% annualized returns over the next 10 years. Kostin highlighted that their model for projecting future returns considers several key factors, including: Initial absolute valuation, market concentration levels, frequency of economic contractions, corporate profitability trends, prevailing interest rates.

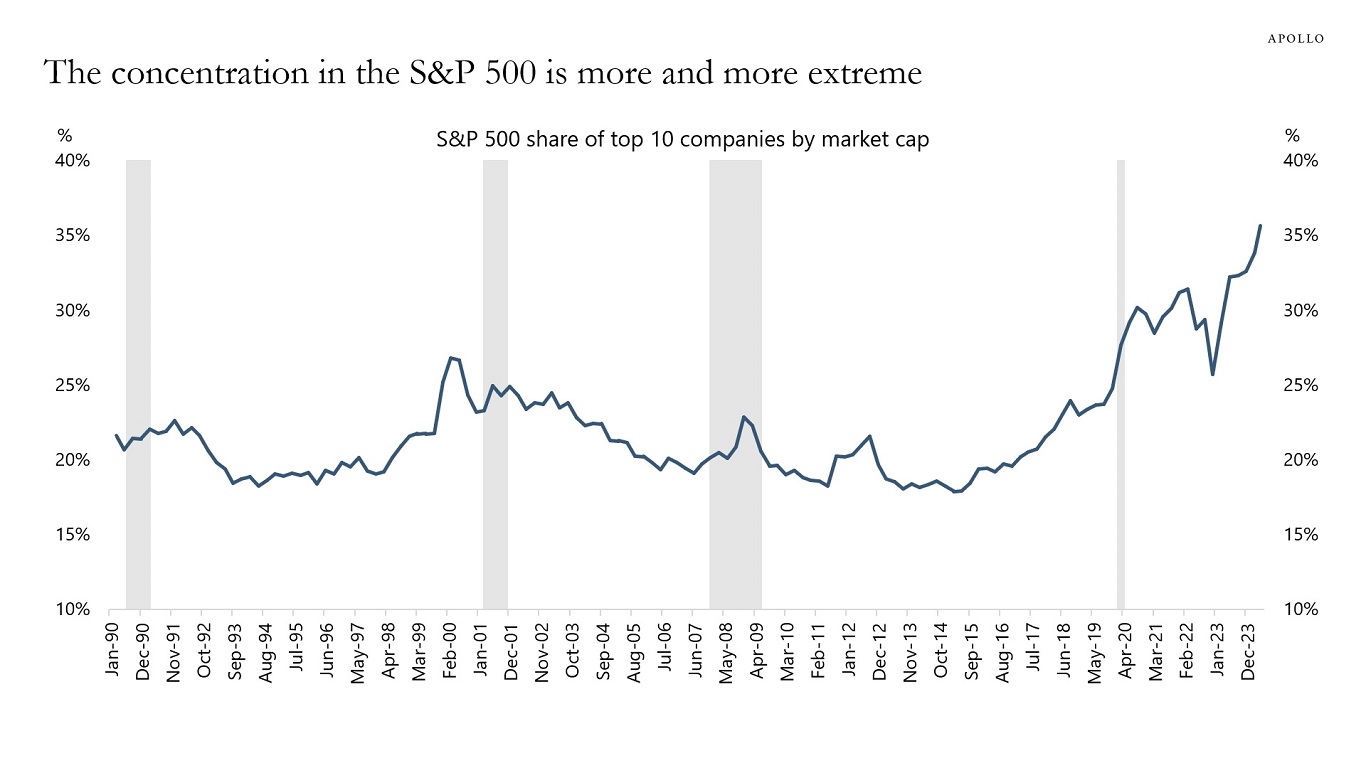
As illustrated in the chart above, the market is currently characterized by extremely high concentration in technological companies. This concentration likely explains why the S&P 500 is trading at above-average valuations, as technology companies typically trade at price-to-earnings (PE) ratios above 20x, driving the overall index multiple higher. In light of this situation, David Kostin anticipates that the S&P 500 Equal-Weight Index (SPW) will likely outperform the cap-weighted S&P 500 (SPX) over the next decade, with an expected annualized outperformance ranging from 2% to 8%.

As reflected in our analysis, the equal-weighted version of the S&P 500 (RSP ETF) has delivered, on average, 1% higher annual returns compared to its cap-weighted counterpart from 2003 to the present.

As shown in the graph above, top 10 stocks in the index have lower earnings volatility and account for more than half of the index earnings, if these fundamentals were to persist, the equal weighted version of the S&P 500 would find it hard to outperform the market cap weighted version.

In addition, large-cap stocks are generally higher-quality businesses with superior returns on capital, which justifies their higher valuations. Considering these factors, we believe the 2-8% annualized outperformance of the equal weighted version of S&P 500 compared to the market-cap version, as stated by Goldman Sachs, to be quite stretched. In our view, a more accurate range would be -3% to 3%.

The histogram above shows the 10-year annualized returns distribution of the S&P 500. Historically, there is an 11% probability that the S&P 500 will yield returns between 0% and 3%, while the likelihood of returns falling below 3% stands at 25%. Typically, over a 10-year period, the S&P 500 delivers annual returns in the range of 9% to 12%. Based on these historical trends, the odds appear to be against David Kostin’s projection.
Conclusion:
While the fundamentals outlined by Goldman Sachs support the expectation of lower future returns, we believe the model used to project this specific return may be overfitted. This indicates that it has been excessively calibrated to historical data, which could hinder its ability to reliably predict future outcomes, especially given the dynamic and complex interactions of financial variables. Furthermore, the model may be underestimating the impact of productivity gains from the ongoing technological revolution, as these factors are not fully reflected in historical data. This revolution is likely to have widespread macroeconomic effects, boosting corporate profitability through improved margins and potentially driving higher revenues, this clearly being a tailwind for US Equities. Consequently, we see a greater likelihood of the S&P 500 achieving annualized returns above 3% rather than below.